Mixed Charts — это задание, которое часто встречается в в Writing Task 1 (Academic), где даны 2 и более чарта. Они могут быть связаны между собой или не связаны. Ваша задача — сделать анализ обоих чартов, не упустив важных трендов и взаимосвязей.
Посмотрите в видео ниже пошаговый алгоритм написания отчета (репорта) по такому заданию.
Вот такая работа получилась:
You should spend about 20 minutes on this task.
The bar chart and the table below show the number of university graduates in six countries and their share in the population in 2010 and 2017.
Summarize the information by selecting and reporting the main features and make comparisons where relevant.
Write at least 150 words.
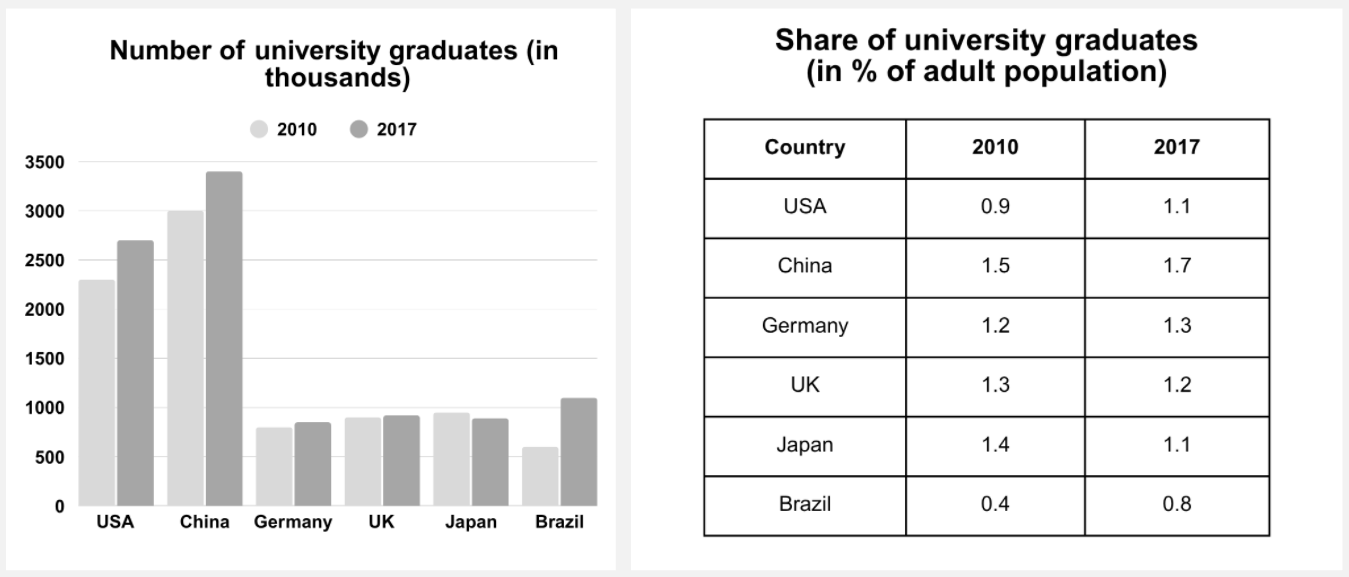
The bar chart compares the quantity of university graduates in six nations in 2010 and 2017, while the table outlines graduate proportions in adult population in the same countries and years.
Overall, the changes in graduate numbers generally correlated with their respective percentages in adult population. While China hosted the majority of graduates, Germany had the fewest. As for percentages, most of them grew, with China being dominant again and Brazil showing the most significant increase.
Starting with the most peculiar trends, China increased its graduate number from 3.0 to 3.3 million over the period, with its share rising from 1.5% to 1.7%. The USA ranked second, climbing between 2.3 and 2.7 million, whereas its proportion showed a slight upward trend, from 0.9% to 1.1%. Meanwhile, Brazil’s university graduate number almost doubled from 0.6 to 1.1 million, and these translated to a sharp twofold percentage rise from 0.4% to 0.8%.
Turning to the other countries, the UK saw a modest growth between 0.8 and 0.85 million, yet its share declined from 1.3% to 1.2%. Japan maintained just under 0.95 million, with a fractional decrease, and its percentage dropped from 1.4% to 1.1%. By contrast, Germany’s total increased marginally from 0.7 to 0.75 million, accompained by a slight rise between 1.2% and 1.3%.
212 words
Все обучающие видео по всем основным видам заданий IELTS Writing Task 1:
Writing Task 1: Как писать отчет по Line Graph
Writing Task 1: Как писать отчет по Bar Chart
Writing Task 1: Как писать отчет по Pie Chart
Writing Task 1: Как писать отчет по Table
Writing Task 1: Как писать отчет по Process
Writing Task 1: Как писать отчет по Map
Writing Task 1: Как писать отчет по Mixed Charts
У нас есть онлайн-курс IELTS Writing Task 1 (Academic)
Полное решение для удаленной подготовки к написанию репортов IELTS Writing Task 1 (Academic), включая:все виды заданий 40 примеров (model answers) алгоритм написания каждого абзаца необходимый вокабуляр и грамматические конструкции возможность сдать на проверку свои письменные работы