Распечатать Writing Task 1 Answer Sheet, куда написать ответ к этому заданию
You should spend about 20 minutes on this task.
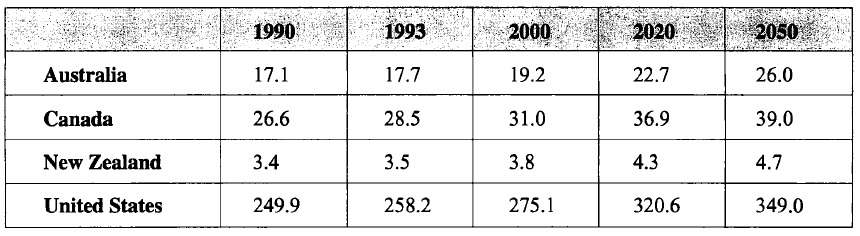
The table below gives information about past and projected population figures in various countries for different years.
Summarise the information by selecting and reporting the main features, and make comparisons where relevant.
Write at least 150 words.
Совет:
Пишите по странам, а не по годам. Тут показаны 4 страны, что даст нам возможность написать по одному предложению по каждой стране.
Стоит сгруппировать страны по степени роста их населения. Например, это можно сделать по возрастанию: Новая Зеландия — на 1.3 млн, Австралия — на 8 млн, Канада — на 13 млн, США — на 100 млн.
Также обратите внимание, что писать нужно как о прошлом, так и о будущем.
Model Answer:
The table provides an overview of the population statistics in four countries since 1990 and until 2050. Overall, it is clear that the populations in all countries are expected to grow, with the USA being the most rapidly expanding nation.
As it is shown, New Zealand’s population rate had a moderate rise in the first ten years of the period and amounted to 3.8 million people in 2000, and this figure is estimated to have a further increase to 4.7 million in 2050. Similarly, the demographic data in Australia demonstrated a slight upward trend from 17.1 million in 1990 to 19.2 million in 2000, and by 2050 this should increase to 26 million people.
As for Canada, its population indicator has been steadily growing from 26.6 million and is likely to reach its highest, 39 million, at the end of the given period. Finally, the United States appears to be the most populated country in this list, whose index increased by 25 million to reach 275 million in the year 2000, and this number is projected to peak at 349 million in 2050.
6 sentences
183 words
Хотите научиться так же писать?
У нас есть онлайн-курс IELTS Writing Task 1 (Academic)
Полное решение для удаленной подготовки к написанию репортов IELTS Writing Task 1 (Academic), включая:все виды заданий 40 примеров (model answers) алгоритм написания каждого абзаца необходимый вокабуляр и грамматические конструкции возможность сдать на проверку до 10 практических заданий

Здравствуйте! На какой примерно балл написаны ваши образцы эссе?
Здравствуйте. Этот образец, скорее всего, потянет на 8,0. Именно такой балл был получен на официальном экзамене и именно такая стратегия использовалась при написании.
The table clearly presents and compares the population statistics in four various countries througout the period between 1990 and until 2050. As an overall trend, United States is the most dominated country on human population among the presented others, whereas New Zeeland demonstrates the lowest number statistics.
According to tha data provided, number of people in New Zeeland was insignificantly wenting up from 3,4 milion in 1990 to 4,3 million in 2020 and this figure is estimated to have a further increase to 4.7 million in 2050. As far as for Canada, its index of population size started to slightly climb from 26,6 million people in 1990 and reached to its peak of 36,9 million after 30 years, and by 2050s this indicator should increase for 2 million. The similar pattern can be observed for Australia, which amount of inhabitants had a moderate rise in the first thirty years of the given time and reached to its top value 40 million. Finally, the U.S. appears to be the most popular country, whose population characterized by an almoust 10-time increase compared Canada and strives to populate over 350 million people by the end of 2050.