Распечатать Writing Task 1 Answer Sheet, куда написать ответ к этому заданию
You should spend about 20 minutes on this task.
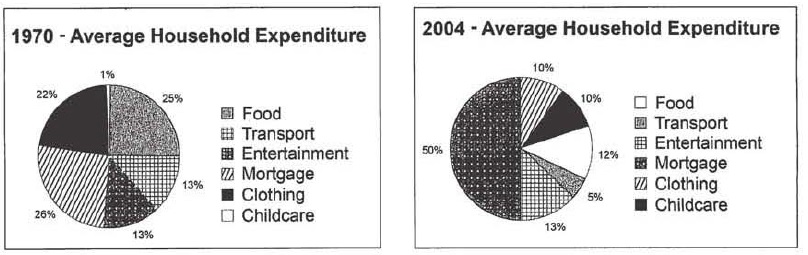
The pie charts below give information about the household expenditure of an average U.S. family in different years.
Summarise the information by selecting and reporting the main features, and make comparisons where relevant.
Write at least 150 words.
Совет:
Выпишите для себя проценты по каждой категории, а затем сгруппируйте по принципу «что увеличилось», «что уменьшилось» и «что не изменилось». Так можно упростить себе задачу и потратить меньше времени на описание. Наша задача — сделать максимум 4-5 предложений во втором абзаце.Food 25-12
clothing 22-10
transport 13-5mortgage 26-50
childcare 1-10entertainment 13-13
Model Answer:
The two pie charts provide data on expenditure patterns in a typical U.S. household in 1970 and 2004. It is clear that the expenses on food, clothing and transport substantially declined over the period, whereas American families tended to spend more on mortgage and children in 2004.
Thus, it is quite obvious from the information presented that food and clothing expenses had a drastic decrease in U.S. household budgets from 25% and 22% in 1970 to around 12 and 10% by 2004 respectively. A similar situation is true for the transportation spending rate that showed an almost threefold reduction to achieve only 5% at the end of the period.
However, the reverse trend is true for mortgage rate which doubled from 26% to 50%, and childcare expenses which rose ten times to 10%. As for entertainment, an average American family used to expend the same amount of money on this in both years at 13%.
6 sentences
155 words
Хотите научиться так же писать?
У нас есть онлайн-курс IELTS Writing Task 1 (Academic)
Полное решение для удаленной подготовки к написанию репортов IELTS Writing Task 1 (Academic), включая:все виды заданий 40 примеров (model answers) алгоритм написания каждого абзаца необходимый вокабуляр и грамматические конструкции возможность сдать на проверку до 10 практических заданий
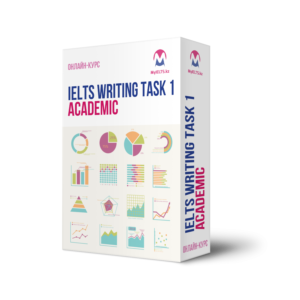
The two pie charts makes an overview of typical house expenditure of U.S. families throughout the period 1970 and 2004. As an overall trend, mortgage spending takes whole half of family expenses in 2004, whereas people in 1970 used to spend just one quarter of their salaries for mortgage.
According to the information provided, food spending demonstration was 25% in 1970,while in 2004 this number has dropped by half. It is interesting to note that money spending for entertainment stayed same in both years- 13% respectively. However, the opposite pattern can be observed on childcare expenditure, which percentage of wasting money shows only 1% in 1970 and displays ten times more result after 34 years. As far as for transport and clothing financial expenditures had a drastic decrease in U.S. household budgets from 13% and 22% in 1970 to around 5% and 10% by the end of 2004.