Распечатать Writing Task 1 Answer Sheet, куда написать ответ к этому заданию
You should spend about 20 minutes on this task.
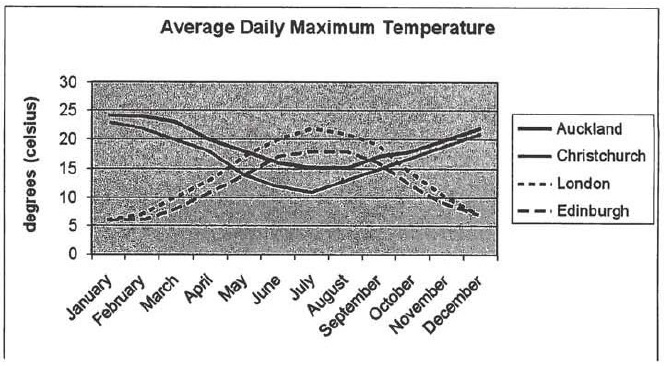
The line graph below shows the average daily maximum temperatures in four cities.
Summarise the information by selecting and reporting the main features, and make comparisons where relevant.
Write at least 150 words.
Model Answer:
The line graph makes an overview of daily peaking temperatures in two cities in the UK, London and Edinburgh, and two cities in New Zealand, Auckland and Christchurch, during a 12-month period. Obviously, maximum temperatures in the British cities are registered in summer, whereas the warmest weather in New Zealand normally takes place in winter months.
Thus, Auckland weather is characterized by the highest average daily temperatures in December and January with about 22 degrees and 24 degrees Celsius respectively, while the lowest indicator is 15 degrees in July. Similarly, the weather pattern in Christchurch shows its top rate in January at 23 degrees, and the cold months in this city are July and August with 11 degrees or slightly higher.
In contrast, London experiences the cold temperature in January, February and December (just over 5 degrees), but the warmest month is usually July with 22 degrees. Predictably, the temperature rates in Edinburgh demonstrate quite similar results with the exception of July, which typically witnesses a temperature of approximately 18 degrees Celcius.
6 sentences
172 words
Хотите научиться так же писать?
У нас есть онлайн-курс IELTS Writing Task 1 (Academic)
Полное решение для удаленной подготовки к написанию репортов IELTS Writing Task 1 (Academic), включая:все виды заданий 40 примеров (model answers) алгоритм написания каждого абзаца необходимый вокабуляр и грамматические конструкции возможность сдать на проверку до 10 практических заданий

The line graph makes an overview of daily peaking temperatures of two cities in UK, London and Edinburgh, and two cities in New Zeeland, Auckland and Christchurch, during a 12-month period. As an overall trend, maximum temperatures in British cities can be shown in summer , whereas the warmest weather in New Zeeland takes place in winter months.
According to the graph, Auckland citys hot weather characterized by a 24 degrees of celsius on January, while on July this rate substantially declined to 15 degrees. The similar pattern is true for Christchurch city, which its peak of warm temperature is roughly 23 degrees and the minimum value dropped to about 10 degrees of celsium on the same month as Auckland city.
The opposite situation can be observed for the capital city of UK, London, which the coldest weather can be noticed on January and December months with 5 degrees, when its maximum index demonstrates nearly 22 degree level between July and August. Its worth noting that, Edinburghs daily temperature had to stay remained similarly as London on winter days.But in contrast of London Edinburgh has well under value of temperature for 5 degrees on the middle of July.
Great job, Perizat! Thanks for sharing.