Распечатать Writing Task 1 Answer Sheet, куда написать ответ к этому заданию
You should spend about 20 minutes on this task.
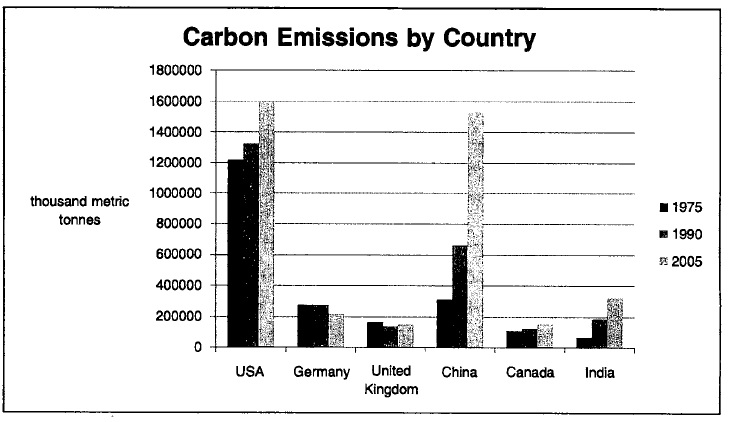
The bar graph below shows the amount of carbon emissions in different countries in three different years.
Summarise the information by selecting and reporting the main features, and make comparisons where relevant.
Write at least 150 words.
Совет:
Группируйте страны, чтобы не писать отдельно по каждой из них. Писать семь предложений (по одному на каждую страну) займет довольно много времени.
Сразу видно два лидера — USA и China. Про них напишем отдельно.
Сгруппировать можно United Kingdom и Canada, Germany и India.
Model Answer:
The bar graph makes an overview of carbon emission statistics in seven countries throughout the period between 1975 and 2005. As an overall trend, the USA and China occupied dominating positions among the countries provided, while Canada and the UK demonstrated the lowest rates.
According to the data, the United States markedly increased their emission rate from about 1.2 million metric tonnes in 1975 to 1.6 million thirty years later. A similar situation is quite clear for China where the carbon indicator showed a dramatic rise from roughly 300 thousand metric tonnes at the start of the period to a peak of 1.5 million by 2005.
By contrast, the indexes in Germany and India, although characterized by different patterns, did not exceed 300 thousand tonnes of emissions over the years given. As for the UK and Canada, their volume of carbon exhausts changed insignificantly and fluctuated at a point of less than 200 thousand metric tonnes.
6 sentences
156 words
Хотите научиться так же писать?
У нас есть онлайн-курс IELTS Writing Task 1 (Academic)
Полное решение для удаленной подготовки к написанию репортов IELTS Writing Task 1 (Academic), включая:все виды заданий 40 примеров (model answers) алгоритм написания каждого абзаца необходимый вокабуляр и грамматические конструкции возможность сдать на проверку до 10 практических заданий

The bar graph makes an overview of carbon emission statistics in six various countries from different mainlands throughout the period between 1975 and 2005. As an overall trend, USA and China dominated the ranking list, whereas UK and Canada presents the lowest amount of carbon footprint during the given time.
According to the graph, in 1975 USA reached to its peak of gas among the presented nations about 1,2 million tonnes, afterwards it gradually went up to 1,6 million tonnes by the end of 2005. As far as for China, whose gas pollution rapidly increased from 3 million tonnes to approximately 15 million tonnes after 30 years from 1975. It is interesting to note that, United Kingdom and Canada have the similar evolution-just under 2 million tones at 1975 until 2005 respectively. Germany demonstrates same results of carbon emission at 2,5 million tonnes in 15 years. It can be observed that India displays substantially growth from 0,8 million tonnes in 1975 to its top value just over 3 million tonnes in 2005.